
ABSTRACT
The American Water Works Association Research Foundation (AwwaRF) and Water Environment Research Foundation (WERF) co-funded a research project titled “Succession Planning for a Vital Workforce in the Information Age.” This study began in January 2003. This study was driven by a number of diverse factors, including:
- The demographics of the current workforce which is expected to result in the loss of sizeable numbers of senior employees during the next 10 years;
- The changing nature of the new, replacement workforce;
- The changing training needs for new employees as our utility plants become more and more automated; and
- Poor preparedness of existing utilities with respect to knowledge management, succession planning and retention.
While water utilities in general must address the issues associated with the changing workforce, the wastewater field is particularly prone to the loss of knowledge as many employment and service tenures coincide with the promulgation of the Clean Water Act in 1972 establishing the basis for the upgraded/expanded treatment plants that followed in the 1970’s and 1980’s. Based on brief introductions of the FCSA participants at the kickoff meeting, it was apparent the average age of the pilot study group met or exceeded the industry age statistics. In one key operational area, all three FCSA employees were in their mid to late 50’s and within several years of retirement.
An approach to capturing important tacit knowledge within a short time frame was developed and The Frederick County Sanitation Authority (FCSA) contributed to the research effort by conducting a knowledge process mapping pilot study with the help of members of the AwwaRF research team. The AwwaRF/WERF project developed a “Knowledge Capture” methodology – the first such demonstration in the water and wastewater utility industry.
The two primary objectives of the pilot study exercise were to map the critical resources and knowledge, and to identify the flow of work that directly adds value or addresses critical operating parameters. This second objective would increase in importance as the knowledge capture exercises were conducted. The exercises revealed secondary benefits to the Authority not directly related to the tacit knowledge sought during the pilot.
KEYWORDS
Succession planning, workforce planning, knowledge management.
INTRODUCTION
For two days, August 25-26, 2003, Black & Veatch and Frederick County (VA) Sanitation Authority (FCSA) conducted a Pilot Study to perform process knowledge mapping and capture to facilitate succession planning in a utility organization.
Located in the Northern end of Virginia’s Shenandoah Valley, Frederick County is currently home to over 65,000 persons, the majority of whom are located in three incorporated cities and towns (Winchester, Stephens City, and Middletown). The County has been adding population at the rate of 3 percent annually over the past decade. The County has also become an employment center, increasing private sector jobs at the rate of nearly 6 percent annually.
Water and sewer services within the County are shared by FCSA, the City of Winchester, and the Frederick-Winchester Service Authority. FCSA operates three treatment plants: two water and one wastewater. FCSA was created in 1974 as a centralized water and wastewater service for the county outside of the City of Winchester. The Authority also purchases finished water from the City of Winchester, which gets its water from the Shenandoah River. Current average water usage in the customer area is 4 million gallons per day.
FCSA also is responsible for water distribution and wastewater collection pipes in their service area. The distribution system is primarily ductile iron and PVC pipe, with limited amounts of cast iron. Services are copper and varying forms of small diameter plastic. FCSA is also responsible for 34 pump stations and a number of grinder pumps within the collection system. Sewer pipe are vitrified clay in the older portions of the system, with asbestos-cement and PVC in the newer portions of the serviced area.
PILOT STUDY APPROACH
The purpose of the pilot study was to map key utility processes, capture critical process knowledge on those processes, share tacit knowledge, identify knowledge “gaps,” and prepare the groundwork for future knowledge capture and dissemination. In preparing for the meeting, Black & Veatch staff prepared a taxonomy of treatment and distribution/collection components and processes that would be used to apply the knowledge mapping to capture the information.
Examples of the apparent knowledge to be captured included methods of calculation and/or analysis, decision criteria, processes of work accomplishment or coordination, experiences and relationships with local suppliers and contractors, experiences with past circumstances, and knowledge of capabilities and limits. Knowledge capture is people-centered, not technologycentered. The key knowledge to be captured is tacit knowledge or knowledge that is unspoken but demonstrated by actions.
The approach to the pilot study consisted of:
- Identification of processes
- Identification of critical processes
- Failure modes and effect Analysis (FMEA)
- Knowledge mapping
IDENTIFYING PROCESSES
Prior to the site visit to Frederick County Sanitation Authority, an attempt was made to identify all of the O&M processes involved in the water and wastewater operations of the utility. We anticipated that a typical water and wastewater utility would have between 800 and 1,000 processes involved in its O&M, engineering, managerial and administrative activities. From a Knowledge Capture standpoint not all of these processes are high risk from a loss of tacit knowledge standpoint. For example, there are undoubtedly many processes which are adequately documented or could be performed adequately by an individual with skills appropriate to the position given available documentation. To identify high risk processes, the utility work teams were asked to score the process list using a three part scoring system:
- Adequacy/availability of documentation
- Likelihood of problem escalation if not immediately addressed (i.e., will the situation get worse if not properly addressed), and
- Impact of the process on other processes (if the process goes bad will it affect other processes?)
Work Teams
After background presentations on the information, tools and procedures to be used over the two days, the group performed a knowledge mapping and capture exercise together in the Wastewater Collection field on the response to physical problems in the collection system to demonstrate the application of the process. Then the Operations and Distribution/Collection staffs split into two sub-groups to address individual processes. The master list of processes that FCSA had identified for the knowledge capture workshop:
- Wastewater Collection
- Wastewater Pump Station Overflows: Loss of Power.
- Reporting/Recordkeeping: Documentation.
- Backup: Mainline Cause
- Planned Work: Cleaning, Performance, SOPs
- Water Distribution
- Service/Restoration Issues: Diameter Equal or Greater Than 16”
- Service/Restoration Issues: Additional Water Needed From Winchester
- Wastewater Treatment
- WWTP General: Fire, Flooding, Storm Damage
- WWTP General: Plant Capacity Expansion
- Biosolids Disposal: New Equipment
- Water Treatment
- Source/Supply Facilities: Loss of City Water Source
- WTP Operations: Response to Process Upsets
- WTP Operations: Manual Control
- Filtration: Replace Media & Support Gravel
- Laboratory: Responses to Water Quality Problems
With the guidance provided by the Black & Veatch Knowledge Management facilitator and Black & Veatch specialists leading the FCSA work teams’ discussions, the two work teams proceeded to complete the mapping and knowledge capture for the selected processes. The nature of the drilling down discussions within the process, and the ownership, responsibility and knowledge determinations to be made, and the calculation of the RPN required several hours to complete for each process.
FAILURE MODES AND EFFECT ANALYSIS
The subsequent Failure Modes and Effects Analysis (FMEA) used a different set of criticality criteria:
- Impact of a failure event, including the severity of the failure effect
- Expected frequency of occurrence, and
- Likelihood that the system will detect the cause or failure mode if it occurs
The FMEA is a method used to evaluate the impact of a failure event, including the severity of the failure effect, the expected frequency of occurrence, and the likelihood the system will detect the cause or failure mode if it occurs. Each of these ratings is scored on a “1-10” basis with greater impact registered by a higher score. The FMEA rating scale is reflected in Figure 1.
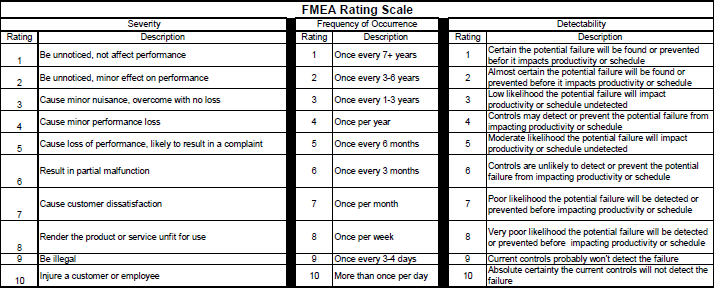
Figure 1. FCSA’s FMEA Rating Scale
Applying the scoring as described in Figure 1 yields the Risk Profile Number (RPN) which is calculated as the product of the Severity, Frequency of Occurrence, and Detectability scores. An initial threshold value of “120” was selected to determine if further “drilling down” within any step of a process was necessary to further define the response to a failure. In practice, this number may be adjusted higher or lower to capture details within the steps as the user deems necessary. As an example, the RPN scoring used in one of evaluated processes is found in Figure 2.
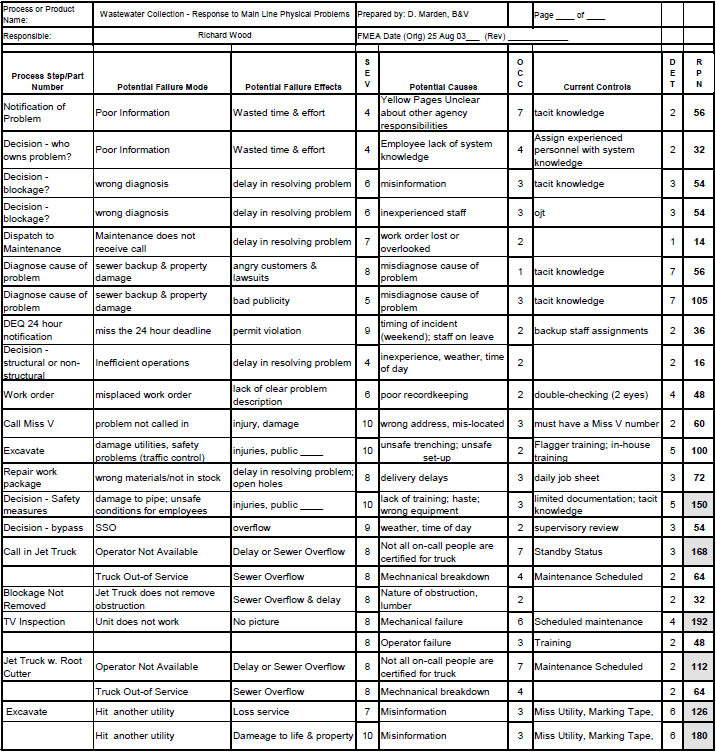
Figure 2. Excerpt of FMEA Worksheet
Initially, individual processes that exceeded the RPN “120” threshold were subjected to further examination to explore and capture the tacit knowledge required to successfully respond to the failure. More experience with evaluating processes will refine the RPN to address the more critical process steps. The work teams’ efforts resulted in the 4 processes for which knowledge process maps were prepared:
- Backup: Mainline Cause
- Service/Restoration Issues: Diameter Equal or Greater Than 16”
- WWTP General: Fire, Flooding, Storm Damage
- WTP Operations: Manual Control
The rating scale used by FCSA is not a standard. The rating scale used by a given utility should fit their needs. For example, a given utility may only need a 1 – 5 rating scale. The consistent aspect is that the greater the risk, the higher the score.
KNOWLEDGE MAPPING
In order to create a knowledge map, some basic parameters related to the “process” had to be defined. These included:
- the process output,
- the user of the output,
- the responsible person(s) in the process,
- the workers in the process,
- the stakeholders or interested parties in the process,
- the beginning and end of the process and
- the quality characteristic of the process.
The flow of the work, critical functions, core resources, best methods, best practices and feedback loops were all important to mapping the process. Identifying those participants in the work flow that add value and those critical participants whose knowledge is difficult to replace are important outcomes of this mapping.
The knowledge map was conceived to be a flow chart with all the appropriate decision steps and alternate flow routes incorporated in the chart. Analyzing the flowchart for knowledge components involved, determining the data and its source, the tools, the equipment, the knowledge involved, the knowledge source and the skills involved. The flowchart mapping was simplified to a series of process steps on an electronic table to aide in the workshop execution. This speeded the mapping and subsequent analytical steps in the process review and knowledge capture exercises.
Four major areas were identified for knowledge mapping and capture prior to the workshop. These included wastewater collection, water distribution, wastewater treatment and water treatment. Several major categories within each process were considered for mapping in the workshop. An example in the wastewater collection field is the response to a sanitary sewer overflow (SSO) event caused by a physical problem in the pipe. Figure 3 is a listing of the steps shown in the process. Figure 4 captures the flow chart examination of this process.
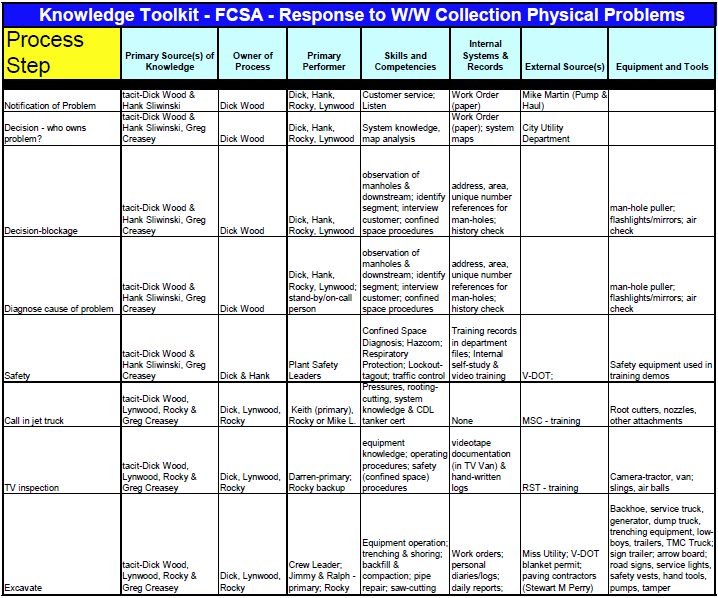
Figure 3. Process Steps Table
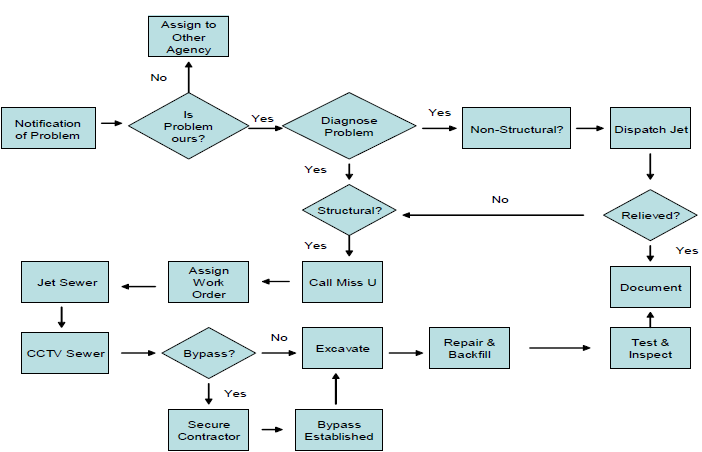
Figure 4. Process Map of Response to Physical Problems in the Collection System
RESULTS
- Standard Operating Procedures: The focus of the workshop initially was extreme events with infrequent but significant impacts. This was derived from the intuition that routine operations and procedures were well mapped with minimal tacit knowledge to be captured because those events were dealt with on a frequent or regular basis. However, in defining the process and the steps to resolve a situation, it was clear many routine, but important functions from the standpoint of employee performance and customer service, lacked good, current standard operating procedures (SOPs). The discussions identified the need to produce current SOPs in many areas of FCSA operations.
- Information Management: The important tacit knowledge that is unique to many of the team members is derived from previous experiences, good and bad, in the field or at the treatment plants. With succession management, the focus is on those employees nearing retirement. It is logical to assume that the more experienced employees have more detailed and unique knowledge. Each member of the work teams, regardless of their position, maintains a personal diary or log. In the diary resides some of the tacit knowledge to be captured. In addition, for facilities such as wastewater pumping stations, a separate log is maintained in the pump station documenting both routine and unusual events, along with the PM schedules and other equipment maintenance performed. A knowledge database that captures these daily observation, maintenance histories, and results of work operations that is available to all employees working in that area enhances the daily operations.
- Documentation: Work is recorded on a daily basis in manually prepared work orders. Work order numbers are not unique in and of themselves and they are filed by month and year for distribution/collection inspections and repairs. If electronic records of customer, sewer segment or water segment histories were maintained and available with the dispatching of the job, a more efficient and complete field response could be implemented by the subsequent staff resolving the problem.
- Geographic Information Systems (GIS): The Utility Director acknowledged that his previous thinking on how to address this issue had focused on GIS technology. He indicated that he now saw the value in an approach that integrated technology solutions with people and process-based thinking and analysis.
OBSERVATIONS
The objective of the workshop was to map the critical resources and knowledge and identify the flow of work that adds value or addresses critical operating parameters. From that perspective, the workshops succeeded in meeting the objectives for the processes mapped. However, there were a number of observations that developed as outcomes that were not foreseen. These observations involved both the process and the substance or results and include;
- Team Size: The process worked with teams of 4 members and a team leader. The drill down within the process was at times tedious. Clear roles among the team emerged in the flow of the mapping and the knowledge capture.
- Risk Profile Number: The RPN score of “120” as a threshold value can be adjusted up or down to increase the sensitivity of the action steps. In the case of the distribution system break/leak analysis, the 120 score was not achieved in any of the process steps identified.
- Source of the Knowledge: The basic information that mapped the knowledge process primarily resided with the owner of the process and was supplemented to varying degrees by the team members.
- Critical Tacit Knowledge: The most important tacit knowledge appears to be at key decision steps, the “triage” of the problem or the decision step on what response to initiate and the tacit knowledge involved. SOPs would provide documentation for many of the other situations more routinely encountered (see “Results” for more discussion).
- Level of Detail: The process worked best when teams avoid excessive detail in the process mapping component of the workshop. A guideline that emerged was 15-18 process steps and decision points yielded sufficient detail to start the process
- Facilitator Role: It is useful to have facilitators who have thorough knowledge of process mapping and knowledge capture tools but have no immediate stake in the execution of the utility process. The facilitator can ask the obvious questions that might otherwise go unasked.
- Role of Technology and Systems: Although the knowledge capture process used centered on people knowledge, it would have been useful to have had a systems/information technology resource available with knowledge of FCSA systems.
- Role of Management: Knowledge capture requires candor about flaws and gaps in the process execution. Although the presence of the Utility Director did not hinder that candor in this case, as a general guideline, it would be productive to question whether senior management should be present when operators are asked to be candid about failure modes and failure causes.
- Meeting Preparation: Operators should be told up front that the process mapping is to improve operations of their process and is not an effort to place blame or responsibility for any existing system or procedural shortcomings.
CONCLUSIONS
Initially, the expected benefit was going to be the ability to apply this knowledge capture process to extreme or limited occurrence events (e.g., flood, drought, large diameter main break), which is the type of situation that an experienced operator or field supervisor may have encountered. That knowledge could then be transferred to aid in resolving a future occurrence. However, routine events where daily experiences were captured primarily in written logs or diaries were more typically captured by this knowledge process. As an added value, the process revealed where current or updated standard operating procedures (SOPs) and availability of inventory or historical data could be of equal or greater value to succession management than emergency response procedures. The “last mile” or smaller gap of knowledge above and beyond the routine could then be targeted for capture as tacit knowledge.
The Knowledge Mapping and Capture process used at FCSA provided a structured approach to an amorphous problem. The tools seemed to work well once the groups had climbed the learning curve and became more comfortable with the facilitators and the process. One indicator of the value of the process was that FCSA supervisors were anxious to receive copies of the process documentation produced during the workshop. There appeared to be genuine interest in preparing for and improving how the staff responds to both routine and critical situations the authority is likely to encounter.
EPILOGUE
Wellington Jones, FCSA Engineer-Director, was extremely pleased with the pilot, noting how helpful it was for the younger members of each process team who learned why certain procedures were being used. One of the more valuable items of tacit knowledge identified was the “triage” process that personnel went through when an emergency call came in.
In fact, when Hurricane Isabel hit the Mid-Atlantic coast in September 2003, FCSA employees were able to pull the knowledge maps for handling plant flooding to expedite the process. It had been nearly 20 years since FCSA had last experienced a plant flooding event.
ACKNOWLEDGEMENTS
We would like to thank Six Sigma black belt and process mapping facilitator Dave Marden for his help in conveying the process mapping concepts to the work teams, Doug Brinkman for his knowledge mapping facilitation, as well as the Frederick County Sanitation Authority personnel whose engagement and participation made the study a success – Hank Sliwinski, Tom Breedlove, Debby Cleghen, Greg Grim, Lynnwood Buracker, Rocky Stump, Richard Wood, and Glen Boireau.
Sumber : www.wef.org/WorkArea/linkit.aspx?LinkIdentifier=id&ItemID=3700